This page needs substantial updating (last updated 14 June 2018; this is version 0.9); we will soon update information about exposure time calculator, MAVISSIM image simulator, perfomance, PSF database etc. Watch this space!
This page contains links to useful information related to the estimated performance of MAVIS. This page will be updated over time to include the latest information available. If you are interested in contributing to these resources with your own simulations or estimates, or if you wish to suggest a particular property to simulate for your science case, please email project-scientist@mavis-ao.org.
MAVIS reference presentations
Three MAVIS presentations are available. Feel free to use them: MAVIS-long (20 pages), MAVIS-medium (10 pages), MAVIS-short (5 pages)
Relevant documents
- ESO’s call for proposal includes Top Level Requirements (TLRs), available on the ESO website (public document).
PSF Simulations
Below are some initial estimates of the PSF from an MCAO system like MAVIS. We will add to this over time with simulations from other consortium/community members.
Disclaimer: These simulations are preliminary, and will be refined during the development of MAVIS. The authors have strived to make the simulations as realistic as possible, but they will not include all possible effects. However, they give a good starting point for understanding the nature of an MCAO PSF, and understanding the potential impacts.
Provided by: Benoit Neichel, Thierry Fusco, Yoan Brule (Laboratoire d’Astrophysique de Marseille – LAM)
Details:
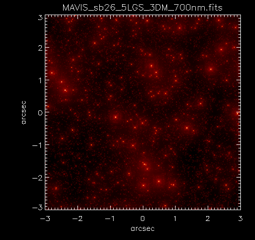
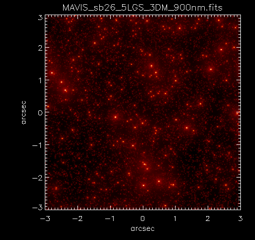
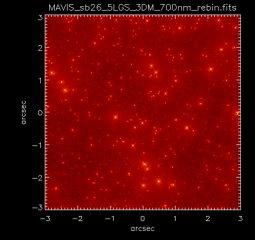
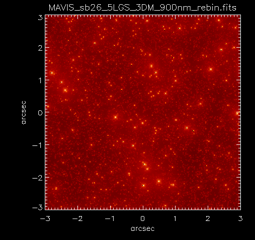
- Input catalogue: These simulations use an input catalogue of stellar magnitudes (linked below) designed to simulate an effective surface brightness (indicated) at a distance of 3.5Mpc, and for a given stellar population that assumes an exponentially decaying star formation rate with a 3 Gyr folding time.
- MAVIS configuration: These simulations assume 5 laser guide stars (LGS) and 3 deformable mirror (DMs), and are monochromatic at the wavelengths shown.
- Field size: The effective field of view is 30”x30”.
- Pixel scale: The original simulations are generated at 2x critical sampling based on the diffraction limit of the VLT at the given wavelength, thus different wavelength images have different pixel scales in arcsec/pixel and image sizes in pixels. These simulations are also provided in a rebinned format, adopting 7.5mas pixels, equivalent to 4kx4k images for a 30”x30” field size.
Table 1: Original simulations (2x Nyquist sampling)
| Effective surface brightness (mag/arcsec2) | 500nm | 700nm | 900nm |
|---|---|---|---|
| 26 (catalogue 47MB) | 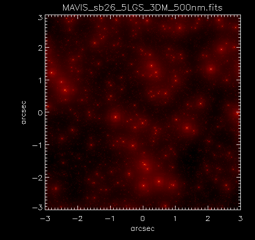 625MB 625MB |
 323MB 323MB |
 196MB 196MB |
| 22 (catalogue 1.9GB) | 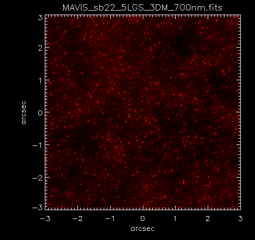 313MB 313MB |
Table 2: Rebinned to 7.5mas pixels
| Effective surface brightness (mag/arcsec2) | 500nm | 700nm | 900nm |
|---|---|---|---|
| 26 (catalogue 47MB) | 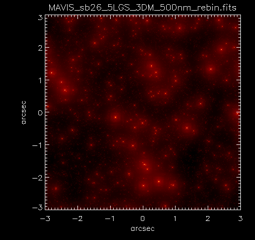 62MB 62MB |
 62MB 62MB |
 62MB 62MB |
| 22 (catalogue 1.9GB) | 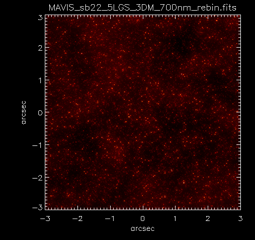 62MB 62MB |
Imaging Point Source Sensitivity
These values come from the simulations described in Esposito et al. (2016, Proceedings of the SPIE, Volume 9909, id. 99093U), which consider different guide star configurations for an optical MCAO system like MAVIS. These will be updated to reflect actual MAVIS predictions in due course.
Assumptions
| Source flux for R=25 | Background Flux | Plate Scale | Read Noise | Throughput | |
| HST/ACS-WFC | 2 ph/s | 35 ph/arcsec2/s | 50 mas | 4 e-/pix | ~0.4 (F625W) |
| VLT | 20 ph/s | 846 ph/arcsec2/s | 10 mas | 2 e-/pix | ~0.3 (VIMOS R) |
Based on these assumptions, signal-to-noise ratio (SNR) is estimated using the standard formula:
\[SNR = \frac{\gamma_{\rm source}}{\left( \gamma_{\rm source} + \gamma_{\rm bck} \; \rho^2 + \sigma^2_{\rm RON} \; n_{\rm pix} \right)^{1/2}}\]where \(\gamma\) are fluxes, \(\rho\) is the area on-sky, \(\sigma_{\rm RON}\) is the read noise and \(n_{\rm pix}\) is the number of pixels.
Results
Performance estimates are given for different natural guide star brightnesses (indicated by their H-band magnitude) for a given off-axis distance of 15 arcsec.
SNR with aperture size
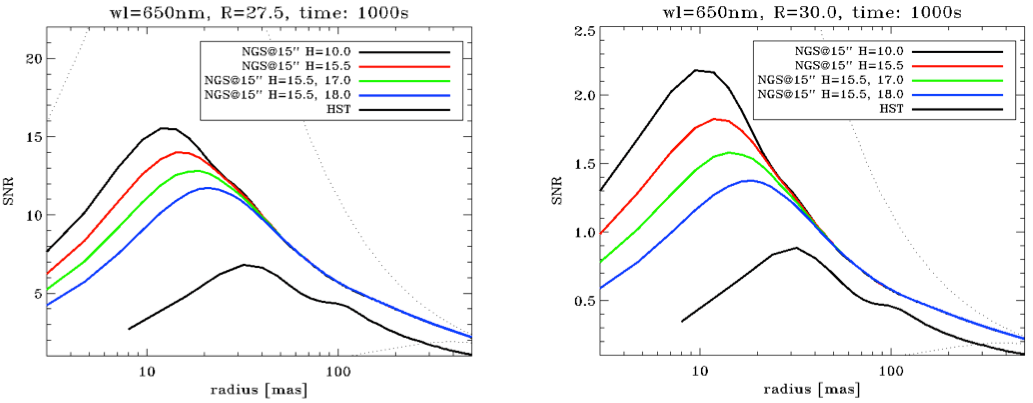
SNR for given integration time and source brightness
| SNR (R=27.5) | HST | NGS@15”, H=10.0 | NGS@15”, H=15.5 | NGS@15”, H=15.5, 17.0 | NGS@15”, H=15.5, 18.0 |
|---|---|---|---|---|---|
| 8mas (radius) | 2.66 | 13.7 | 11.5 | 9.8 | 8.2 |
| 25mas (radius) | 6.19 | 12.5 | 12.5 | 12.0 | 11.4 |
| SNR (R=30.0) | HST | NGS@15”, H=10.0 | NGS@15”, H=15.5 | NGS@15”, H=15.5, 17.0 | NGS@15”, H=15.5, 18.0 |
|---|---|---|---|---|---|
| 8mas (radius) | 0.34 | 2.1 | 1.7 | 1.4 | 1.1 |
| 25mas (radius) | 0.82 | 1.4 | 1.4 | 1.4 | 1.3 |
Integration time (in hours) for given S/N and source brightness
| Int. Time (hr) SNR=5 (R=27.5) | HST | NGS@15”, H=10.0 | NGS@15”, H=15.5 | NGS@15”, H=15.5, 17.0 | NGS@15”, H=15.5, 18.0 |
|---|---|---|---|---|---|
| 8mas (radius) | 0.98 | 0.04 | 0.05 | 0.07 | 0.11 |
| 25mas (radius) | 0.18 | 0.04 | 0.04 | 0.05 | 0.05 |
| Int. Time (hr) SNR=5 (R=30.0) | HST | NGS@15”, H=10.0 | NGS@15”, H=15.5 | NGS@15”, H=15.5, 17.0 | NGS@15”, H=15.5, 18.0 |
|---|---|---|---|---|---|
| 8mas (radius) | 61.1 | 1.6 | 2.6 | 3.9 | 6.2 |
| 25mas (radius) | 10.2 | 3.4 | 3.4 | 3.6 | 4.0 |